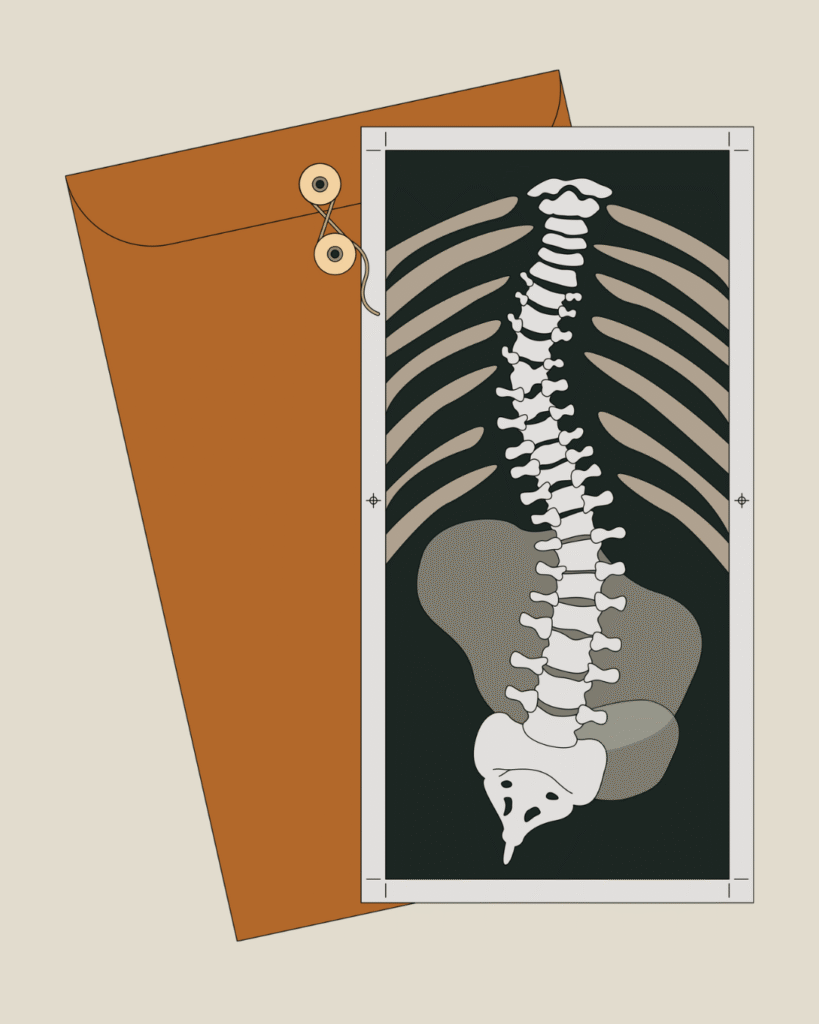
scan findings
Doctors often order MRI scans of the spine to look for possible causes of back pain.
The reports may include many alarming terms: “wear and tear,” “disk bulges,” “osteophytes,” “degeneration” and so on.
However, these findings are extremely common, even in people who feel perfectly fine. In fact, they are usually signs of adaptation — changes that show how the body has adjusted over time, much like grey hair or wrinkles reflect the passage of life.
Sometimes, an MRI does reveal something important, such as a pinched nerve or a more serious condition. But in most people with back pain, there is nothing dangerous or “broken” to be found in their spine.
A large study from Germany looked at thousands of people — some with back pain and some without. The results were surprising:
More than 75% of people had signs of “wear and tear” on their MRI, even if they had no pain at all.
These changes became more common with age. In fact, over 90% of people over 70 had something on their scan.
People with pain were slightly more likely to have these findings, but the difference was small.
Even when someone had 5 or more changes on their scan, the average pain score was less than 1 point higher (on a 0–10 scale). That’s not much.
Most of these scan results didn’t predict who would still have pain years later.
In 2015, a systematic review was published in the American Journal of Neuroradiology. The authors looked at 33 studies with more than 3,000 people who had no back pain but underwent MRI scans.
They found that changes such as disk degeneration, bulges, and protrusions were very common and became more frequent with age, even in people without symptoms. Their conclusion was that many of these findings are simply part of normal aging and are not necessarily linked to pain.
| Imaging Finding | Age (yr) | ||||||
|---|---|---|---|---|---|---|---|
| 20 | 30 | 40 | 50 | 60 | 70 | 80 | |
| Disk degeneration | 37% | 52% | 68% | 80% | 88% | 93% | 96% |
| Disk signal loss | 17% | 33% | 54% | 73% | 86% | 94% | 97% |
| Disk height loss | 24% | 34% | 45% | 56% | 67% | 76% | 84% |
| Disk bulge | 30% | 40% | 50% | 60% | 69% | 77% | 84% |
| Disk protrusion | 29% | 31% | 33% | 36% | 38% | 40% | 43% |
| Annular fissure | 19% | 20% | 22% | 23% | 25% | 27% | 29% |
| Facet degeneration | 4% | 9% | 18% | 32% | 50% | 69% | 83% |
| Spondylolisthesis | 3% | 5% | 8% | 14% | 23% | 35% | 50% |